In this article and tutorial we will explain how to use QWATT to monitor and predict PPA prices.
The captured prices are the volume-weighted achieved spot price per MWh over a given period of time. The time series we are using is the actual production of the renewable source in a price area, combined with the actual hourly area price. Qwatt shows historical captured prices going back to 2018.
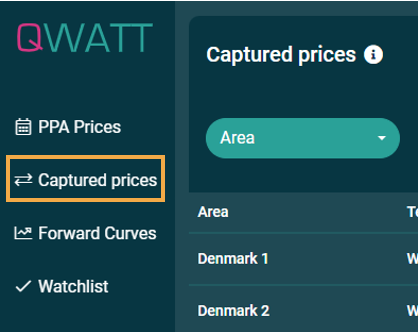
When you are within the service, click on Captured Prices.
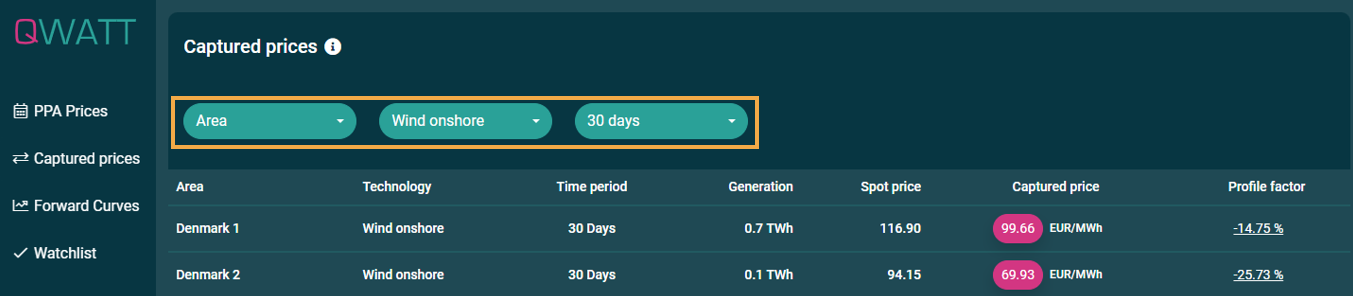
You then start with selecting the area of interest, the technology and the time period. You can select multiple options if you wish to compare based on the criteria you chose.
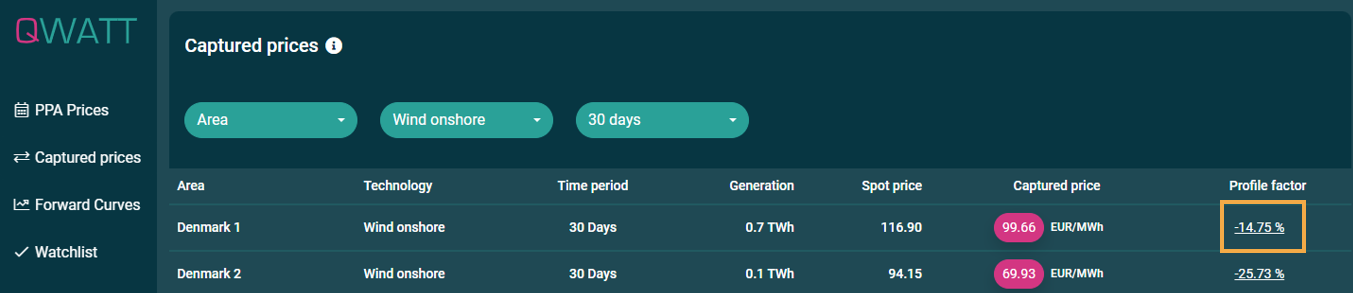
You will see the captured price. This is an average price based on the selected time periods.
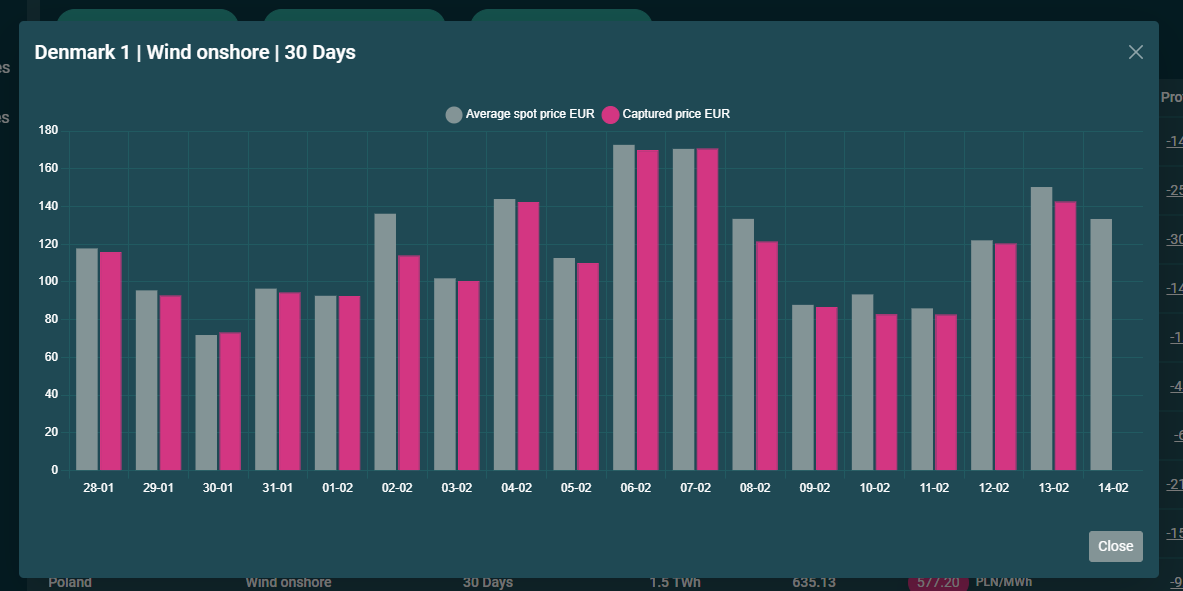
You will get an overview of the period by clicking on the captured price. A graph will open which enables you to see the average spot price combined with the captured price.
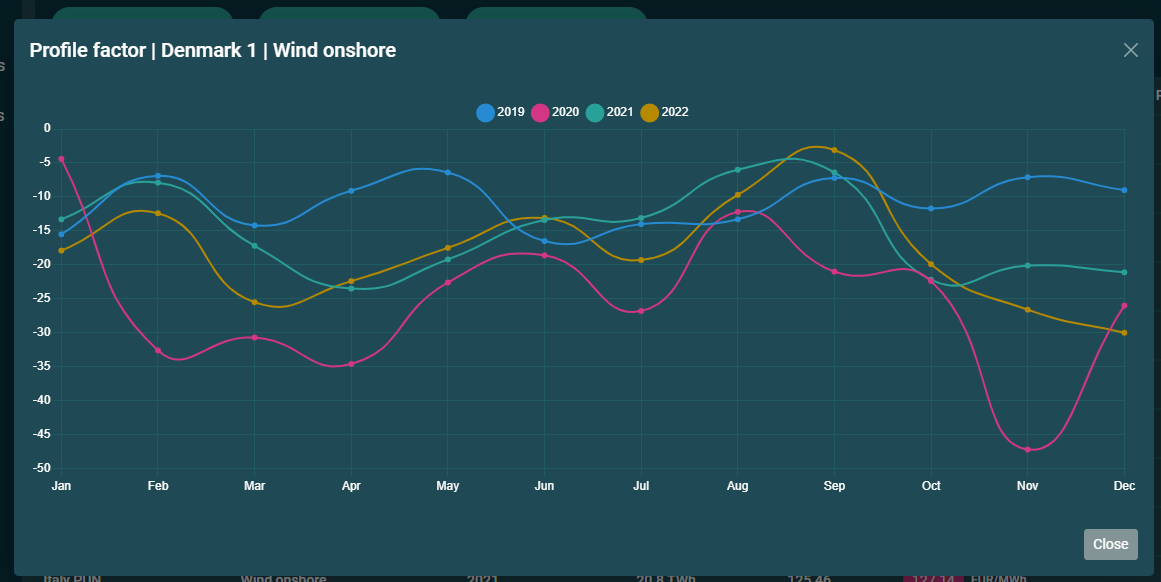
We also calculate the profile factor, which is the deviation from the base load price. You will be able to see how the profile factors has changed by clicking on the profile factor to the right.