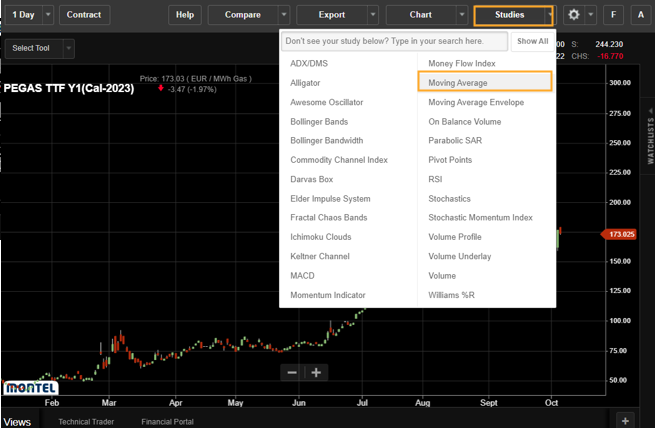
In this article, we will navigate you through how to add and remove studies. Follow these easy steps below to learn how to do so.
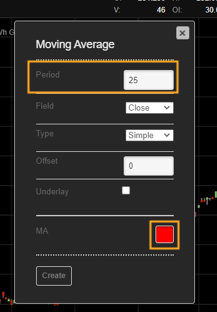
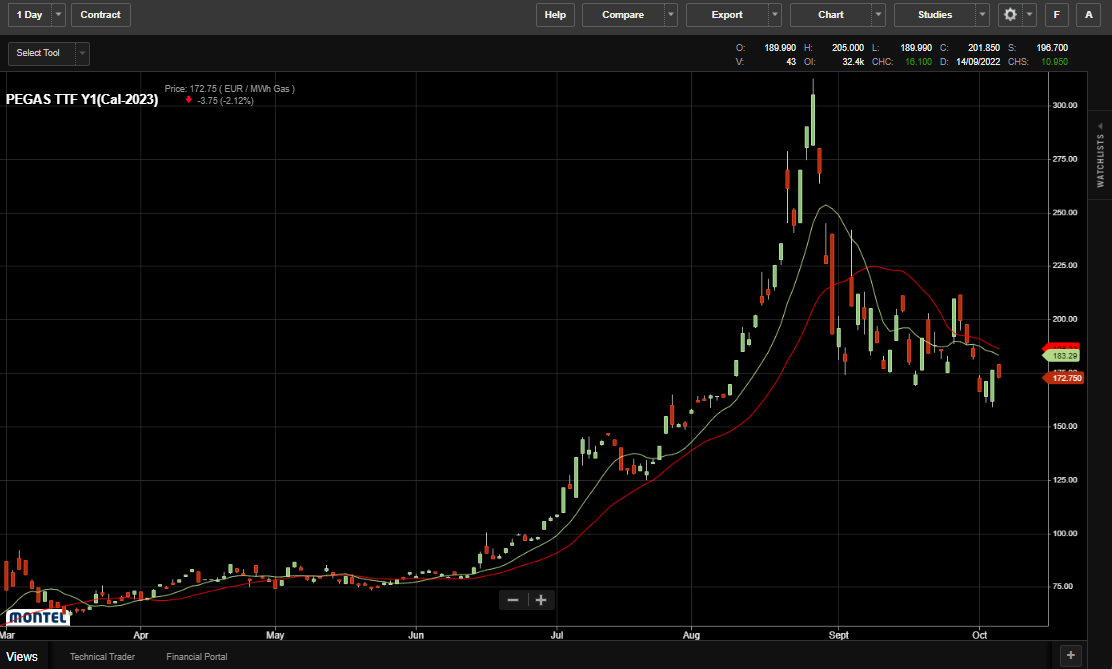
Start på opening a contract and navigate to "Studies" in the menu. We can add a moving average of 21 days and an exponential moving average with a red line. Click "Create".
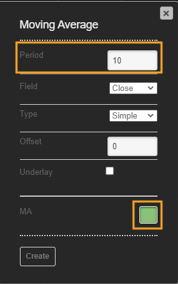
We can then add another moving average for ten days exponential moving average again, and change the color to a green line.
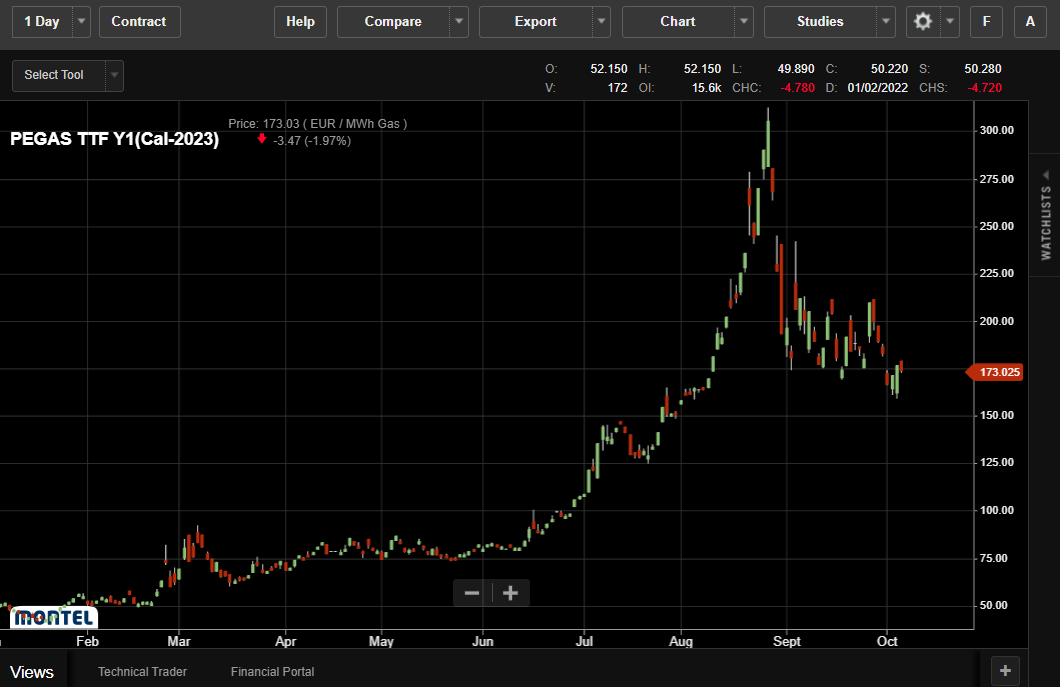
We have now added two lines of moving averages to the technical analysis chart for this front-year contract on the Dutch gas market.
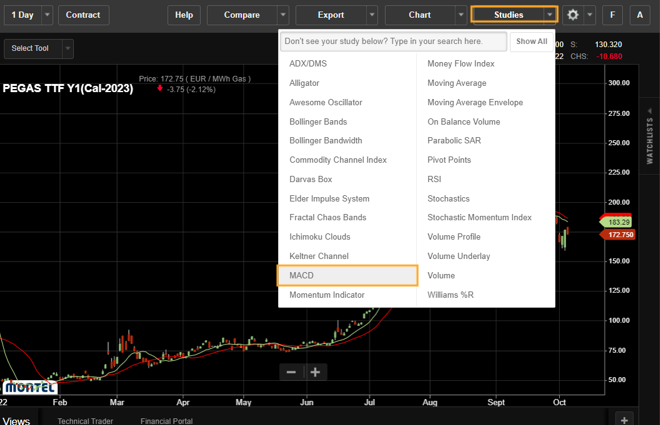
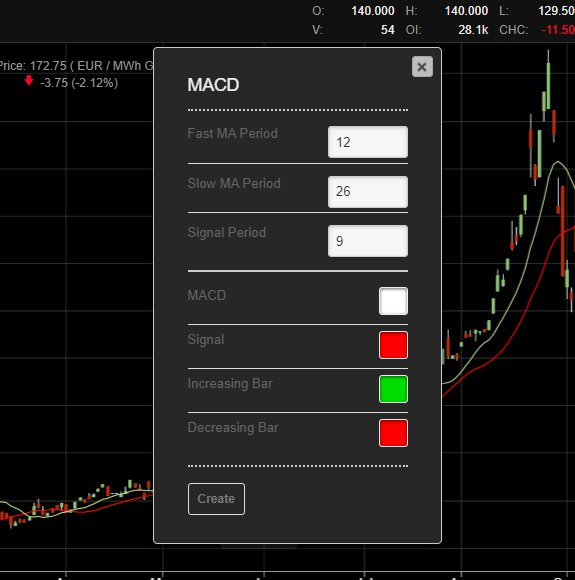
Now, let us add other indicators, such as MACD.
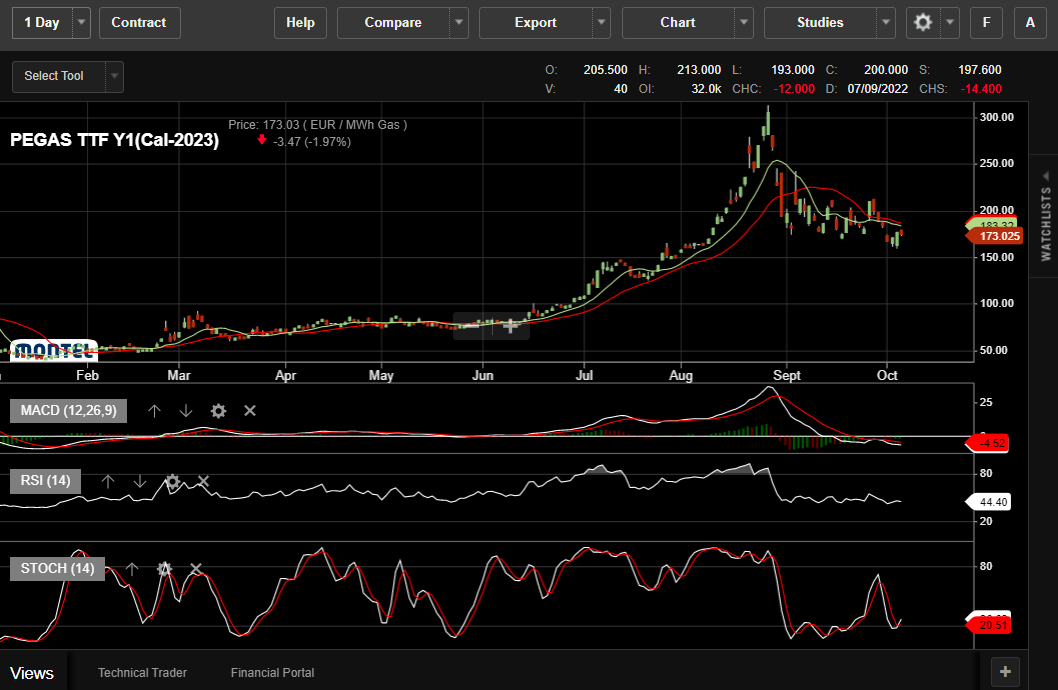
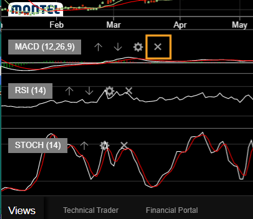
In addition, we can add the RSI and Stochastics from the studies menu. All these three indicators are momentum analysis indicators, which can give you a quite good sell and buy signals. With this we have made a technical analysis chart with quite much information.
If we wish to remove some of the symbols, we just "x-out" the different studies.
Furthermore, to remove the moving averages line, simply right-click on the line and "delete".