Personal pages allow you to create your own market screen from scratch, visualizing your own mix of news, market data, charts, and 3rd party websites. This article will guide you in setting up your personal page within Montel Online.
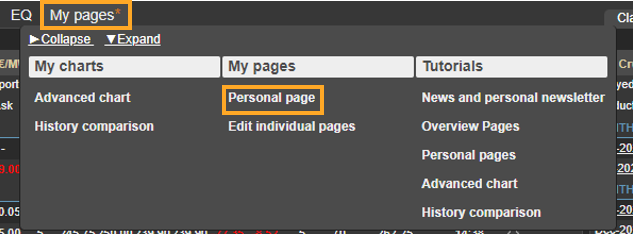
1. Navigate to "My Pages" in the menu and choose "Personal Pages" in the dropdown menu.
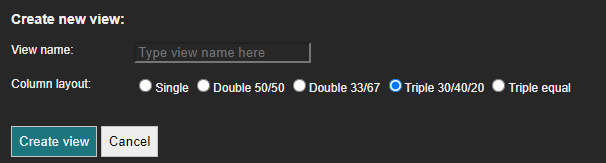
2. Click "Create view", type in the name of the view, and choose the column layout. Thereafter, click "Create view" to save your settings.

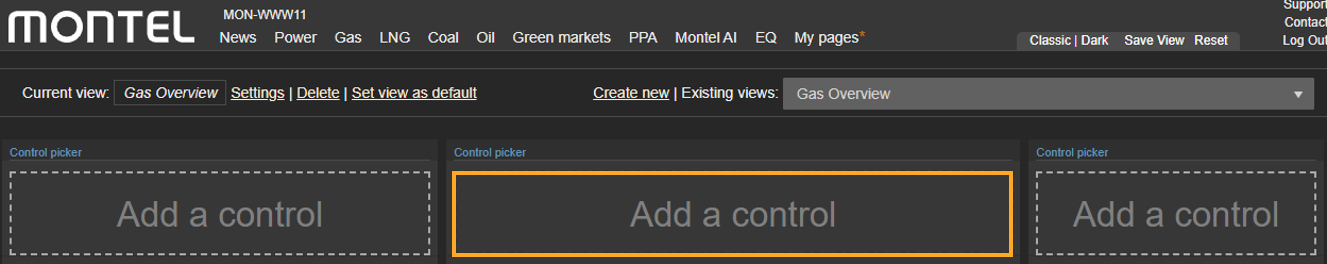
3. The column layout previously chosen will now appear in frames and you can now start selecting the contents for each frame by clicking "Add a control".
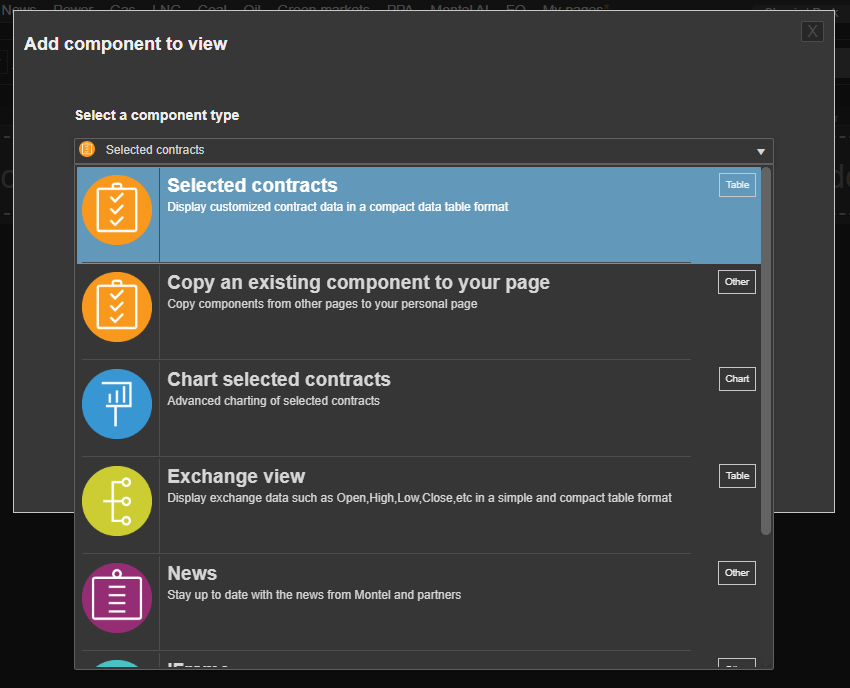
4. Select from the pop-up menu the type of frame(s) you wish to use and then customize the content. You may add any content from the full range of components within the service.
5. Drag and drop the frames within your personal page(s) to rearrange the layout. However, you may not adjust the width of the columns.
Control Menu explained:
Selected contracts
1. Type in the title of your own wish and select from the drop-down menu the commodity, types of contracts (OTC or exchange traded), and source (exchange or broker).
2. Choose between two types of contracts: Relative (all active contracts +1 rolling) or Static (expired and prompt contracts).
3. Select contract periods from the drop-down list (months, quarters, years, etc.).
4. Delivery is a handy date picker to find expired contracts.
5. Edit the contract list to select/unselect by clicking on a contract.
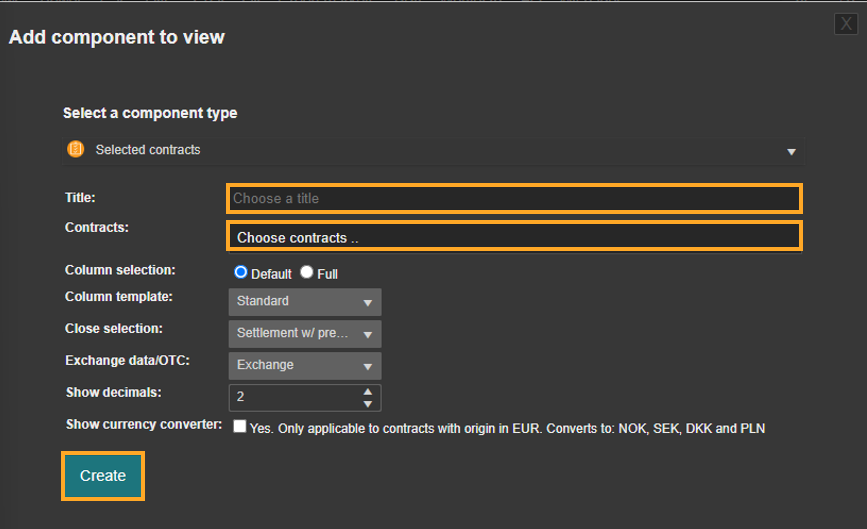
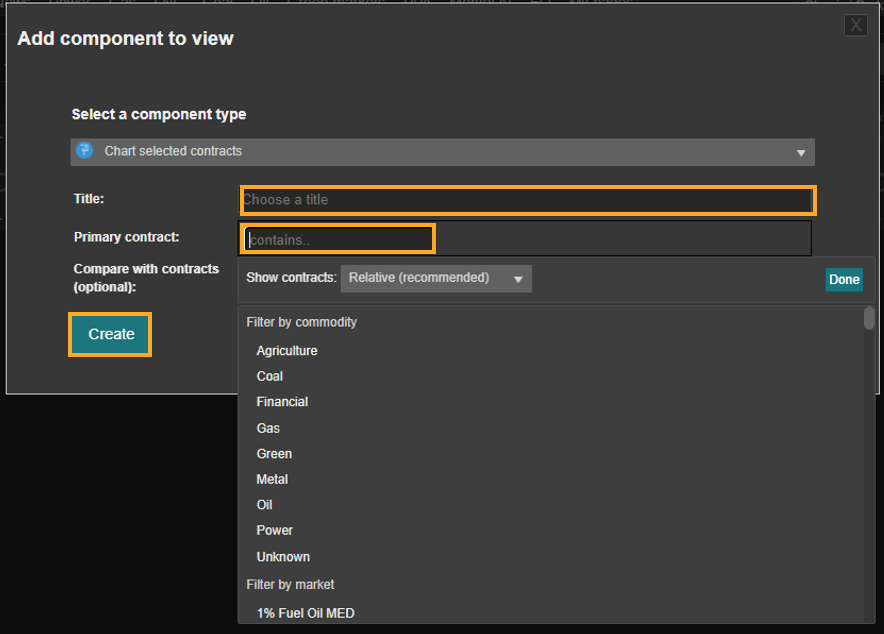
Chart selected contracts:
1. Assign a name for the Chart and choose your contracts. Select the primary contract of choice for the chart, also, you may add further comparison contracts into the window via compare (not mandatory).
The selection of contracts for the chart is done in the same way as for Selected contracts, as explained previously.
2. Then, add the chart to your page with "Create".
3. You can make adjustments directly in the chart of your personal page. The pen allows you to make adjustments to the content. By clicking on the pop-out symbol you can load the chart into an extra window.
You now have all the options for customizing the charting, and you can use your defined views or add new studies (indicators).
Comments, trendlines, or other tools from Select tools are saved in the personal page chart, and changes are automatically applied when you exit full-screen mode and are displayed in the reduced view.