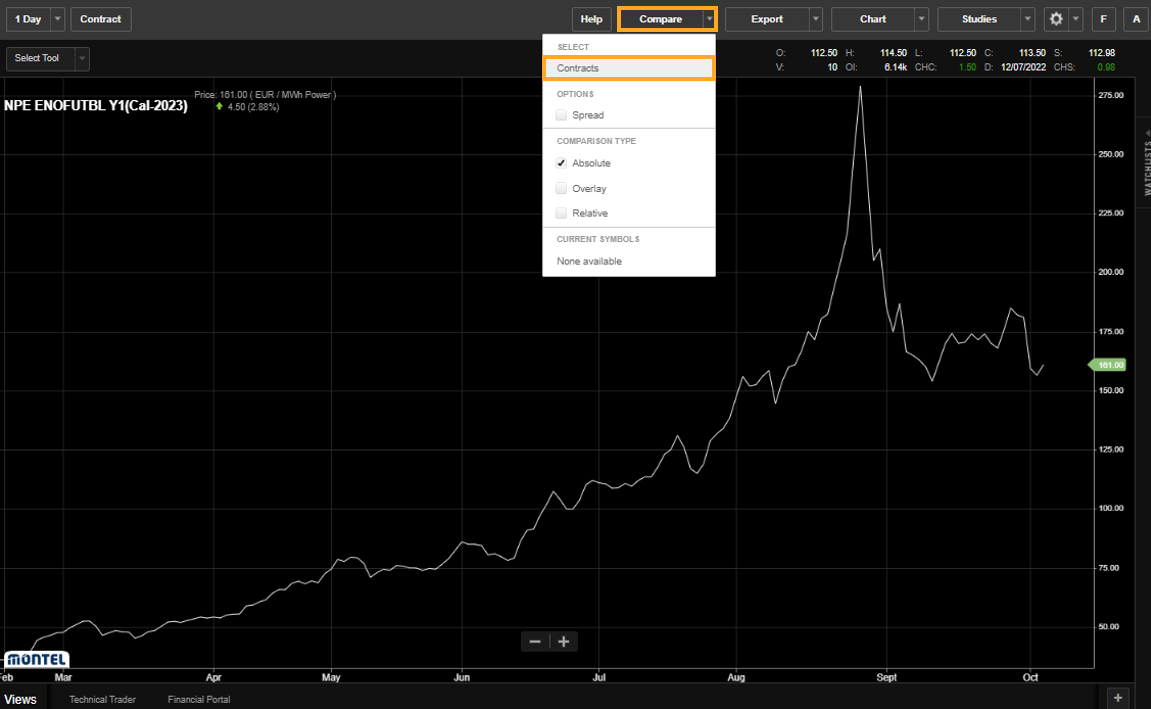
In this article, we will guide you step by step through the process of creating a spread chart and how to use the comparing tool. We will guide you through an example using Nordic Power Nasdaq compared with German Power EEX.
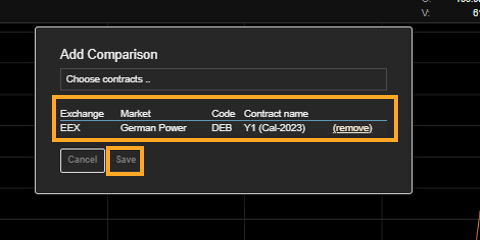
Start by opening a contract of interest. In this example, we will select Nordic Power Nasdaq. "Navigate to "Compare" in the upper menu and choose "Contracts". After that, select the contract you want to compare, in this example, we will select German Power EEX, and click save.
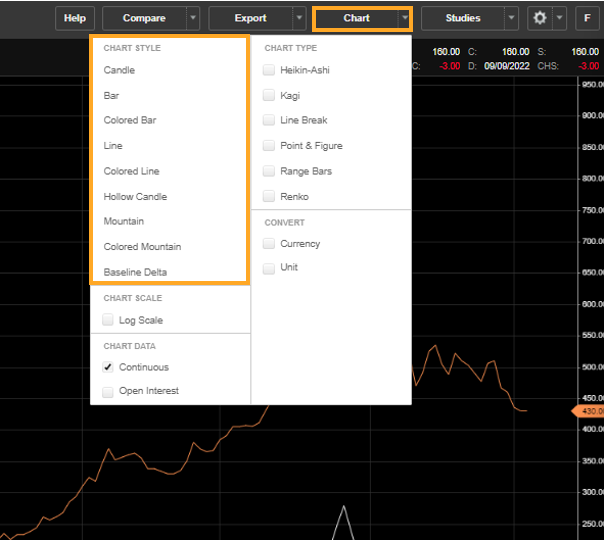
You can easily switch chart style from line to other chart styles, by navigating to "Chart" and selecting your preferred chart style.
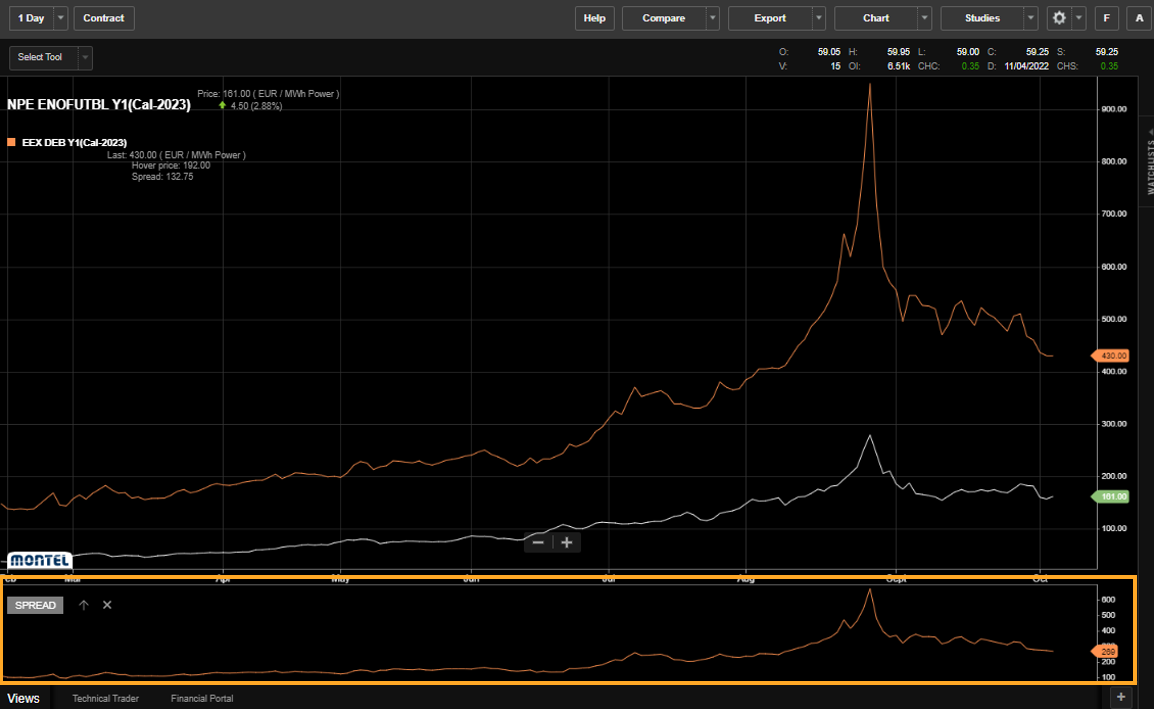
If we want to make a spread between the contracts, navigate to "Compare" and select "Spread".
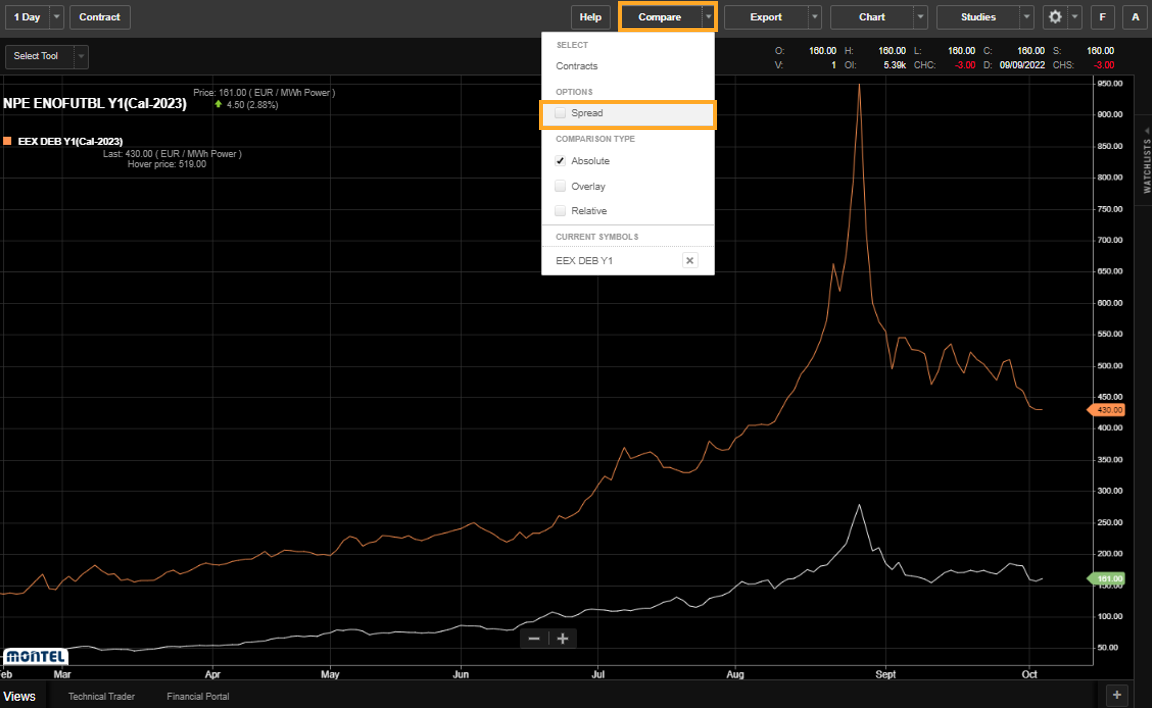
The Spread graph will now be visualized at the bottom, showing the differences in the market. In this example, we have a difference between the markets Nordic Nasdaq and German EEX of 275 EUR per megawatt hour.